Quarter 2, Lesson 3 – Effective Communication
On February 12th – in just three weeks – you’ll be required to submit checkpoints for your report and code. This article will cover best practices that will apply to all of your deliverables this quarter, but primarily your report. In the coming weeks, we’ll look more closely at how to produce scientific posters and static websites.
Table of contents
Overview
By the end of the quarter, you’ll produce* a report, a poster, a public-facing website, each of which will require you to explain your work to a different audience through a different medium. The key to effective communication is knowing who your intended audience is.
- For your report, your audience is senior-level data students in other domains – that is, data scientists who generally know about the methods you’re using, but not about your domain.
- For your poster, your audience is industry partners, faculty, and pre-senior data science students. These individuals may know some details of the methods you’re using, but won’t necessarily have the background you have by taking DSC 80, 100, 102, 106, 140A, etc.
- For your website, your audience is the general public.
For the remainder of this lesson, we’ll discuss how to best tailor your work to various target audiences, and provide general tips on how to write effectively.
The content of this article builds upon Lesson 3 from Quarter 1, on Scientific Writing. It’s a good idea to review it before proceeding, and certainly before writing the draft of your report, as your report must read like a scientific paper.
*You’ll also produce a public-facing GitHub repository, but that’s not relevant for the purposes of this lesson.
Principles
Regardless of the audience, here are some general principles you should follow:
- Be as specific as possible. Vagueness causes confusion. Use concrete and testable terms, and refrain from using adjectives and adverbs. (For instance, instead of saying “Our classifier is much more accurate than the previous state-of-the-art model on similar tasks” , say “Our classifer achieves a testing accuracy of 84% on TritonDataset, higher than the previous record set by TritonModel of 81%.”)
- Avoid unnecessary terminology and the curse of knowledge. That is, define and explain concepts in plain English so that other data science majors outside of your domain and hiring managers at your dream company can understand what you did and why it’s relevant. After writing a report, website, or poster, step aside and try to unlearn the things you already know. Then, approach the draft again with a fresh pair of eyes – more often than not, you will find blindspots of your earlier self.
- Try to tell a story! Regardless of the platform, you are telling a story about your data. Stories are easier to follow if you have a main argument. Decide what is the central dramatic argument of your delivery. Have a strand of arguments taht lead to the main point if it is complicated. Spend more time on the parts of your analyses that are interesting, and quickly cover the parts that are uninteresting (but still report them).
Knowing Your Audience
The primary way in which you’ll tailor your explanations of your work to suit different audiences is by controlling the amount of detail discussed. This will allow you to engage each target audience without losing them with overly complicated jargon or boring them with basics they’re already familiar with.
To do this well, you need to be intimately familiar with your project yourself and understand it hollistically, from the birds-eye view of why it’s relevant down to the details. An age-old saying is “the best way to learn something is to teach it to someone else,” and a big part of why that’s true is because teaching exposes gaps in your knowledge. To make sure that you truly understand your project’s context and details, try explaining it to people with a variety of backgrounds:
- Your teammates.
- Others in your domain, not on your team.
- Others in the capstone, not in your domain.
- Pre-senior data science students.
- Friends from high school not pursuing data science (and adjacent) degrees.
- High school students and elementary school students (if you somehow know any!).
You’ll find that it can be just as hard, if not harder, to discuss your project with a general audience who knows nothing about data science or your domain as it is to discuss it with your teammates and your domain mentor.
For each of the target audiences below, we’ll discuss what you’ll focus on in your communications with them, and also what you’ll gain from communicating with them.
| Audience | Approach |
|---|---|
| Domain Experts, e.g. domain mentors, others in your domain | Regularly discussing the details of your work with your teammates will allow them to identify any gaps in your understanding. You may find them saying, “Is that really what you did, and are you sure that’s correct?” Many of these technical details may not make it into your final deliverables explicitly, but it will be clear whether or not you understand the details of your project to other experts when they look at your methods and results sections and browse through your code. In weekly section meetings, you’ll have an opportunity to discuss your project with others in your domain at a slightly higher level than you would with your teammates, which will allow you to ensure that your understanding is still consistent when the tinest of details are not relevant. |
| Other Data Scientists, e.g. other capstone students not in your domain, mentors and faculty at the capstone showcase | To those who have a similar understanding of data science methodology as you do, you will spend most of your time discussing how problems in your domain are generally approached, and the specific methods that you’re using in your project. You won’t need to discuss every single implementation detail with this audience, but they should understand the gist of the methods used. This is the audience to which most of your report will be tailored to, as well as your poster presentation at the capstone showcase and some sections of your website. Make sure not to provide too many details as to be overwhelming – think critically about what this audience needs to know, and make sure you provide just enough context for them to be able to understand. |
| Educated Public, e.g. non-DS majors in university, high school students with some quantitative literacy | This audience will not have the background to understand your implementation details. Instead, focus your communication on the problem you’re working on and why it is relevant and impactful. Discuss how the problem is approached with data – for instance, what kinds of data is relevant for solving the problem, how it’s collected, and how it is relevant – but keep the technical terminology to a minimum. (For instance, it’s fair to assume that most people in this audience know about means and standard deviations, but not about how neural networks work.) Spend a fair bit of time discussing the results and their broader implications. |
| General Public, e.g. elementary school students, readers of news articles | This audience my not have any statistical training, and so the focus should be on describing the field in which the problem lies, why the problem is important, and what the implications of the results are. |
Providing Context
In Lesson 3 from Quarter 1, we emphasized the importance of starting broad and gradually providing more details, when writing an introduction or providing an elevator pitch.
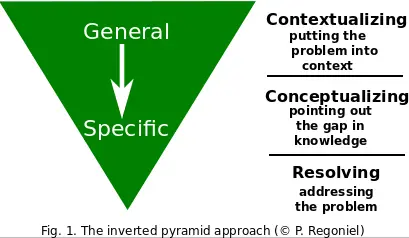
(source)
In such cases, you should expect to spend about 50% of your time introducing the problem area and providing context, and much less time on specific details. By framing the problem being solved, you can make what may otherwise seem like a boring result sound impactful.
The definition of “broad” depends on the audience. To a trained data scientist, “broad” might refer to how your project fits into your field, whereas to the general public, “broad” might refer to how your field fits into the world as a whole; you can’t expect the general public to know much about your field a priori.
In Lesson 3 from Quarter 1, we also introduced the related context, content, conclusion approach to structuring scientific communication. At the time, we brought this up in the context (no pun intended) of scientific papers, but it’s also useful when structuring oral presentations and websites. This model allows you to bring your audience gently up to speed with your work – it’s important to remember that they’re just hearing about your work for the first time, and haven’t spent the past few months working on it.
- Context: Tell the audience what you are going to tell them – tell them why they should care.
- Content: Tell them about your approach and results.
- Conclusion: Recap your content, and how it is relevant with regards to the context you provided at the start.
In this way, you tell your audience about your work three times, giving them time to digest the material.
Throughout your communication, make sure to weave through examples that illustrate your points. Good examples are explicitly tied to the point being made, and take very little setup.
It will be nearly impossible to write a report or website that explains everything at the right level in one shot. Instead, aim to iterate on your work regularly (as the Agile method of product management suggests). By repeatedly rewriting your introduction, you will clarify to yourself how your project fits in with the bigger picture in your domain, and potentially discover new ways in which your work is relevant.
Again, to effectively explain your work to others, you need to deeply understand it yourself. To improve your understanding, and hence your work itself, frequently practice discussing your work with others.
Examples and Exercises
As a reminder, at the bottom of the Quarter 2 Project specifications, we provided several examples of projects broken down into websites, papers, and code repositories. If you haven’t already, you should try and find an example there that matches the structure of your project and use it as inspiration as you start to complete your deliverables.
To help you get started, work on the following exercises.
Exercise 1: Finding Exemplars
The details and norms of effective communication vary by field – the norms in biology are different than those in computer science, for instance. Look to your mentors to provide you with best practices.
So that you’re familiar with work that meets your mentors’ standards, do the following:
- Find two examples in your field of writing to a specialist. (These may be papers you read or replicated in Quarter 1.)
- Find two examples in your field of writing to a general audience. (For instance, look at blog posts or news articles.)
- Do the same for oral presentations. (For instance, look at university or conference presentations and TED talks.)
Exercise 2: Communicate Thorugh Specificity
Specify the problem that your project is solving in concrete, testable terms and hypotheses.
- If you’re working on an analysis project, you should define what a “good” result means.
- If you’re building a product, you should have a quantitative metric for what “success” looks like.
Exercise 3: Write Your Results Now!
As counterintuitive as it may be, it can be a good idea to write your results section immediately after writing your introduction section.
While you won’t have the actual numbers yet, you can create placeholder graphs and tables that, eventually, will contain key results. By doing this, it will clarify what you need to accomplish in your methods section to have a complete report. Make sure to create multiple sets of figures for different audiences.