2️⃣ Quarter 2 Project
last updated Tuesday, January 9th, 2024
These specifications have been updated for Winter 2024. If any changes are made throughout the quarter, we’ll send an announcement on Ed.
Overview
You will have to produce four main deliverables for your Quarter 2 Project. Each deliverable is discussed in more detail in a separate page, linked below. In the Philosophy section of this page, we’ll discuss why each of these requirements exist.
| Checkpoint Due Date | Final Due Date | |
|---|---|---|
| Report | Sunday, February 11th | Thursday, March 14th |
| Code | Sunday, February 11th | Thursday, March 14th |
| Website | Sunday, February 25th | Thursday, March 14th |
| Poster and Presentation | Poster checkpoint due Sunday, February 18th Presentation checkpoint delivered in Week 8 Check-In | Poster due Sunday, March 10th Presentation will be at capstone showcase on Friday, March 15th |
Make sure to click and thoroughly read through all four pages linked in the first column of the table above!
Roughly speaking, you’ll spend the first half of the quarter working on your project, and the second half preparing your deliverables and rehearsing your presentation. All deliverables have an accompanying checkpoint, which serve to ensure that you’re on track to finish all components in time and to give you an opportunity to receive feedback from your mentor and methodology staff.
All deliverables and checkpoints must be submitted as a group on Gradescope. The only component you will submit individually is a “contribution statement” towards the end of the quarter. Each deliverable will be graded using the same A/B/C/F rubric from Quarter 1; different group members can end up with different grades for the same work, depending on the answers to the weekly participation questions and the contribution statement.
The deadlines for each deliverable and checkpoint are above and on the course homepage. To reiterate, the most important dates are:
- Friday, March 15th from 11AM-2:30PM, which is when the in-person capstone showcase is. This will be attended by UCSD faculty and students, and HDSI industry partners. All capstone students will be required to present their poster either during the 11AM-12:30PM block or the 1-2:30PM block; we will assign groups to blocks sometime in February.
- Sunday, March 10th at 11:59PM, the deadline by which you must submit to us a PDF of the poster you will present at the capstone showcase. We are coordinating a bulk order with campus printing services and they may not be able to print your poster in time if we receive it any later than that. (You will not have to pay for your poster.)
DSC 180B is a 4-unit course, which per campus rules means you should expect to spend 12 hours per week on it total. Remember that your goal in DSC 180B is to produce a capstone project you’ll be proud to show others and look back at in the future, not just to receive an A.
In addition to the aforementioned deliverables and checkpoints, you’ll need to complete two mandatory check-ins with your TA – one in Week 3 and one in Week 8. Additionally, during Weeks 5-6, all groups will also be required to meet with Professor David Danks to discuss the ethical implications of their work.
Philosophy
Why so many deliverables? The idea is that your report, poster, and website all exist to explain your work to different audiences. The key to effective communication is knowing who your intended audience is. (Your public-facing GitHub repository isn’t particularly relevant to this discussion.)
- For your report, your audience is senior-level data students in other domains – that is, data scientists who generally know about the methods you’re using, but not about your domain.
- For your poster, your audience is industry partners, faculty, and pre-senior data science students. These individuals may know some details of the methods you’re using, but won’t necessarily have the background you have by taking DSC 80, 100, 102, 106, 140A, etc.
- For your website, your audience is the general public.
Before starting to work on any of these deliverables, read the rest of this page, in addition to rereading Lesson 4, on Effective Communication and Scientific Writing.
Knowing Your Audience
The primary way in which you’ll tailor your explanations of your work to suit different audiences is by controlling the amount of detail discussed. This will allow you to engage each target audience without losing them with overly complicated jargon or boring them with basics they’re already familiar with.
To do this well, you need to be intimately familiar with your project yourself and understand it hollistically, from the birds-eye view of why it’s relevant down to the details. An age-old saying is “the best way to learn something is to teach it to someone else,” and a big part of why that’s true is because teaching exposes gaps in your knowledge. To make sure that you truly understand your project’s context and details, try explaining it to people with a variety of backgrounds:
- Your teammates.
- Others in your domain, not on your team.
- Others in the capstone, not in your domain.
- Pre-senior data science students.
- Friends from high school not pursuing data science (and adjacent) degrees.
- High school students and elementary school students (if you somehow know any!).
You’ll find that it can be just as hard, if not harder, to discuss your project with a general audience who knows nothing about data science or your domain as it is to discuss it with your teammates and your domain mentor.
For each of the target audiences below, we’ll discuss what you’ll focus on in your communications with them, and also what you’ll gain from communicating with them.
| Audience | Approach |
|---|---|
| Domain Experts, e.g. domain mentors, others in your domain | Regularly discussing the details of your work with your teammates will allow them to identify any gaps in your understanding. You may find them saying, “Is that really what you did, and are you sure that’s correct?” Many of these technical details may not make it into your final deliverables explicitly, but it will be clear whether or not you understand the details of your project to other experts when they look at your methods and results sections and browse through your code. In weekly section meetings, you’ll have an opportunity to discuss your project with others in your domain at a slightly higher level than you would with your teammates, which will allow you to ensure that your understanding is still consistent when the tinest of details are not relevant. |
| Other Data Scientists, e.g. other capstone students not in your domain, mentors and faculty at the capstone showcase | To those who have a similar understanding of data science methodology as you do, you will spend most of your time discussing how problems in your domain are generally approached, and the specific methods that you’re using in your project. You won’t need to discuss every single implementation detail with this audience, but they should understand the gist of the methods used. This is the audience to which most of your report will be tailored to, as well as your poster presentation at the capstone showcase and some sections of your website. Make sure not to provide too many details as to be overwhelming – think critically about what this audience needs to know, and make sure you provide just enough context for them to be able to understand. |
| Educated Public, e.g. non-DS majors in university, high school students with some quantitative literacy | This audience will not have the background to understand your implementation details. Instead, focus your communication on the problem you’re working on and why it is relevant and impactful. Discuss how the problem is approached with data – for instance, what kinds of data is relevant for solving the problem, how it’s collected, and how it is relevant – but keep the technical terminology to a minimum. (For instance, it’s fair to assume that most people in this audience know about means and standard deviations, but not about how neural networks work.) Spend a fair bit of time discussing the results and their broader implications. |
| General Public, e.g. elementary school students, readers of news articles | This audience my not have any statistical training, and so the focus should be on describing the field in which the problem lies, why the problem is important, and what the implications of the results are. |
Providing Context
In Lesson 4, we emphasized the importance of starting broad and gradually providing more details, when writing an introduction or providing an elevator pitch.
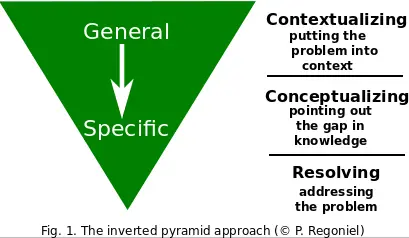
(source)
In such cases, you should expect to spend about 50% of your time introducing the problem area and providing context, and much less time on specific details. By framing the problem being solved, you can make what may otherwise seem like a boring result sound impactful.
The definition of “broad” depends on the audience. To a trained data scientist, “broad” might refer to how your project fits into your field, whereas to the general public, “broad” might refer to how your field fits into the world as a whole; you can’t expect the general public to know much about your field a priori.
In Lesson 4, we also introduced the related context, content, conclusion approach to structuring scientific communication. At the time, we brought this up in the context (no pun intended) of scientific papers, but it’s also useful when structuring oral presentations and websites. This model allows you to bring your audience gently up to speed with your work – it’s important to remember that they’re just hearing about your work for the first time, and haven’t spent the past few months working on it.
- Context: Tell the audience what you are going to tell them – tell them why they should care.
- Content: Tell them about your approach and results.
- Conclusion: Recap your content, and how it is relevant with regards to the context you provided at the start.
In this way, you tell your audience about your work three times, giving them time to digest the material.
Throughout your communication, make sure to weave through examples that illustrate your points. Good examples are explicitly tied to the point being made, and take very little setup.
It will be nearly impossible to write a report or website that explains everything at the right level in one shot. Instead, aim to iterate on your work regularly (as the Agile method of product management suggests). By repeatedly rewriting your introduction, you will clarify to yourself how your project fits in with the bigger picture in your domain, and potentially discover new ways in which your work is relevant.
Again, to effectively explain your work to others, you need to deeply understand it yourself. To improve your understanding, and hence your work itself, frequently practice discussing your work with others.
Examples
For inspiration, you may want to look at the deliverables produced by past capstone students – you can view last year’s projects here. Below, you’ll find a few selected examples (the same ones we showed you in the Quarter 2 Project Proposal spec last quarter).
- BlockBazaar - Smart Contracts for Decentralized E-Commerce
Matin Ghaffari, Yu Huang, Alan Amirian, Wenyuan Chen (Mentor: Sheffield Nolan from Franklin Templeton)
🪧 Poster • 🌐 Website • 📖 Report • 💻 Code - FinDL: Deep Learning Library for Finance Applications
Nathan Ng, Richard Tang, Gao Mo (Mentor: Zhiting Hu)
🪧 Poster • 🌐 Website • 📖 Report • 💻 Code - Evaluating Fungal Feature Importance in Predicting Life Expectancy for Cancer Patients
Ethan Chan, Mark Zheng, Benjamin Sacks (Mentor: Rob Knight)
🪧 Poster • 🌐 Website • 📖 Report • 💻 Code
And below, we provide examples of non-capstone data science projects. Pay close attention to how they’ve chosen to separate their website, report, and code.
| Topic | Components |
|---|---|
| FACT Diagnostic: How to Better Understand Trade-offs Involving Group Fairness | Website explains the paper’s main points Paper contains the main results and proofs of correctness Code reproduces the project and provides a usable tool |
| A New Model To Scale Up Forest Restoration From Sites To Landscapes | Website intended for general audience (with an interactive visualization) Paper contains scientific investigation Code reproduces project |
| recount2: A multi-experiment resource of analysis-ready RNA-seq gene and exon count datasets | Website makes datasets (output of project) available Paper justifies and demonstrates the project Code contains source code for the tool |
| kallisto | Website introduces and contextualizes the software Paper describes usefulness and correctness of method Code contains source code for the tool |
| VoytekLab, a lab with multiple projects | Website contains introduction to the problems approached by the lab Papers contain the details of the results Code lists source for both tools/libraries and for reproducing papers |
| LightGBM | Website briefly introduces project and contributors Paper describes correctness of algorithm Code contains library for algorithm usage |